More on Lists
Read time: 8 minutes (2043 words)
We learned a bit about lists in our last lecture. This time, we will see more on how useful these list things can be!
Creating a list
Let’s start off by generating a list of numbers. The range function should
be able to do that:
>>> l = range(20)
>>> print(l)
range(0,20)
Hmmm, that did not work like I expected it to! In fact range is a special
function Python calls an iterable. We will not study this kind of function
in this class, but to generate the list, All I need to do is alter the way I
try to build it:
>>> l = list(range(10))
>>> print(l)
[0, 1, 2, 3, 4, 5, 6, 7, 8, 9]
Now we are getting somewhere!
Here is an interesting way to build up a list where all the elements are the same:
>>> z = [0]*10
>>> print(z)
[0, 0, 0, 0, 0, 0, 0, 0, 0, 0]
I wonder what happens if I add two lists:
>>> s = l + z
>>> print(s)
[0, 1, 2, 3, 4, 5, 6, 7, 8, 9, 0, 0, 0, 0, 0, 0, 0, 0, 0, 0]
As we saw with strings, a list added to a second list gives a new list with the elements of both in the order specified.
Another way to do the same thing is this:
s = l
s.extend(z)
>>> print(s)
[0, 1, 2, 3, 4, 5, 6, 7, 8, 9, 0, 0, 0, 0, 0, 0, 0, 0, 0, 0]
This approach does not work (I am still scratching my head over this):
>>> s = l.extend(z)
>>> print(s)
None
I guess since the extend function does an in-place change, it returns no value.
List slices
Suppose you wanted the sequence from 5 to 15. We can slice off that segment of
this list by using the Python slice notation:
>>> l = list(range(20)
>>> s = l[5:16]
>>> print(s)
[5, 6, 7, 8, 9, 10, 11, 12, 13, 14, 15]
There is that funny problem again. The slice range notation stops one short of the last value!
We can do other kinds of slices:
>>> l
[0, 1, 2, 3, 4, 5, 6, 7, 8, 9, 10, 11, 12, 13, 14, 15, 16, 17, 18, 19]
>>> l[:16]
[0, 1, 2, 3, 4, 5, 6, 7, 8, 9, 10, 11, 12, 13, 14, 15]
>>> l[5:]
[5, 6, 7, 8, 9, 10, 11, 12, 13, 14, 15, 16, 17, 18, 19]
If you leave off the first number in the slice rance, the initial number is zero. If you leave off the last number, the end point is the last item in the list. What do you think you get if you leave off both numbers? (Trick question!)
l[:]
[0, 1, 2, 3, 4, 5, 6, 7, 8, 9, 10, 11, 12, 13, 14, 15, 16, 17, 18, 19]
Makes sense - right?
Lists can hold different kinds of things
Suppose we had a group of people and we wanted to store information about each one. We might do this:
person1 = ['Sarah', 'Fenway', 'f123456', 99]
person2 = ['Richard', 'Penn', 'p234567', 89]
person3 = ['Scott', 'Lauder', 'l54321l', 87]
What would happen if we constructed a list of people in this group?
students = [person1, person2, person3]
Here is some code to print out data from this super list:
s1 = students[1]
print(s1[0])
print(s1[1])
print(s1[2])
print(s1[3])

print(students[2][0])
Here is what we get when running this code:
python3 MultiList.py
[['Sarah', 'Fenway', 'f123456', 99], ['Richard', 'Penn', 'p234567', 89], ['Scott', 'Lauder', 'l54321l', 87]]
['Sarah', 'Fenway', 'f123456', 99]
['Richard', 'Penn', 'p234567', 89]
['Scott', 'Lauder', 'l54321l', 87]
Richard
Penn
p234567
89
Scott
That is not so bad, once you get used to remembering what each element in your list actually is. If it is another list, just tack on another set of square brackets to step inside that list!
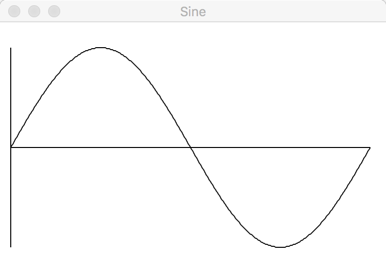
Graphics using Lists
Let’s look at a program that plots the sine of X where X ranges over values from 0 to 360 degrees.
Here is the code that does that:
1 2 3 4 5 6 7 8 9 10 11 12 13 14 15 16 17 18 19 20 21 22 23 24 25 26 27 28 29 30 31 32 33 34 35 36 37 38 39 40 41 42 43 44 45 46 47 48 49 50 51 52 53 54 55 56 57 58 59 | # SinePlot.py - draw a plot of the sin(x) from 0 to 360
from graphics import *
from math import sin, pi
def draw_axes(this_win):
''' Draw axes for the sine plot'''
x1 = 10
y1 = 125
x2 = 370
y2 = y1
Line(Point(x1,y2),Point(x2,y2)).draw(this_win)
x1 = 10
x2 = x1
y1 = 25
y2 = 225
Line(Point(x1,y1),Point(x2,y2)).draw(this_win)
def gen_data():
'''
generate the sine(x) for angles from 0 to 360
return a list of the values
'''
vals = []
for angle in range(361):
x = angle * pi / 180
sine = sin(x)
vals.append(sine)
return vals
def plot_data(data, this_win):
''' plot the data on the window'''
angle = 0
x1 = 10
y1 = data[0]* 100 + 125
angle = 1
while angle <= 360:
x2 = angle + 10
y2 = 125 - data[angle]*100
Line(Point(x1,y1),Point(x2,y2)).draw(this_win)
angle += 1
x1 = x2
y1 = y2
def main():
print("Sine Plotter")
# draw the axes on the window
win = GraphWin("Sine", 380, 250)
draw_axes(win)
# generate the data to plot
data = gen_data()
#print(data)
# Plot the data on the window
plot_data(data,win)
win.getMouse()
main()
|
Here is what I got when running this: