Simple Graphics with Python3
Read time: 32 minutes (8125 words)
We have seen simple functions already. The sqrt function you used in a
previous example is just a named block of code you can activate (we call it
“calling a function”) by referring to its name in our code. All function names
are followed by parentheses, and usually you provide some data for the
function to use when it works. Some functions return values, and others do not.
We will learn how to write our own functions later. For now, I want you to get some practice writing code that uses functions written by someone else. To make this more fun, we will do some graphics programming! We are going to draw a few simple pictures. (No space aliens yet, but just simple things).
Getting help with graphics
The author of another Python textbook has created a nice set of graphics functions we can use, and all we need is one file from him to do the kinds of graphics projects I want to use in this class.
Installing the tools we need
The file you need to download is this:
There are two ways to use this library. The “right” way is to copy the
graphics.py file into the Python installation folder. That way any Python
project you create can use graphics with a single line added to your code file.
To install the file, you will need to locate the Python installation. (It
probably is under one of the C:\Program Files folders on your system,
depending on which version of Python you installed.) Place the single
graphics.py file in the lib\site-packages folder under your Python
installation folder.
Note
On some systems,, Windows security setting might prevent placing this file where it needs to go. See me if you have problems,
The second way to use the library is to just make sure the graphics.py file
is in your project folder with your program file. If you use this option, you
will need up copying this file into each project that involves graphics, but
this will work as well.
Here is a file containing documentation for this library:
Testing Your Installation
Test your installation by doing this:
c:\> python
Python 3.2.3 (default, Apr 11 2012, 07:12:16) [MSC v.1500 64 bit (AMD64)] on win32
Type "help", "copyright", "credits" or "license" for more information.
>>> from graphics import *
If you get no error messages, the file was found by Python and you are ready to go.
If you copied the file into your project folder, you will need to change to
that directory before starting Python. It will look in the current directory
for the grphics.py file when you enter that “import” line.
Experimenting with graphics
The easiest way to get familiar with this graphics idea is to play around a bit. Let’s do this from the command prompt.
Setting up a project folder
First, create a new folder to hold this project. I will call mine
GraphicsDemo. Here is an example command to build this file from a
command prompt window:
c:\COSC1336> mkdir GraphicsDemo
c:\COSC1336> cd GraphicsDemo
c:\COSC1336\GraphicsDemo>
Now, start up the gVim editor. You should immediately save the file (even
if it is empty) as demo.py in the GraphicsDemo folder. That way, the
editor knows we are working on a Python program.
Opening up a graphics window
In the editor, enter this code:
from graphics import *
win = GraphWin()
win.getMouse()
The first line tells Python that we want to use the functions found in the
graphics.py file. The second line tells the system that we want to create a
new window on the screen.
The third line looks different, and it is. Welcome to your first encounter with
a concept named objects. The win thing is not a simple variable, but a
complex thing that is more like a function. It is a box containing data, and
other functions that the object knows how to run. You will learn more about
objects later in this course, and in your C++ courses. For now, just think of
that line as us asking the troll in the win box to activate the
getMouse function that it has inside the box. What happens is that the
program stalls until you press a mouse button.
Save the file, switch over to the command prompt window and run the code.
python demo.py
You should see something like this on your screen:
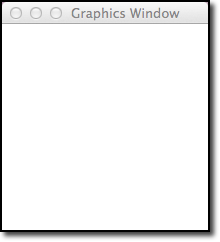
Note
These images were captured on my Mac and will look different on Windows or Linux.
The window will disappear when you click the mouse inside the white area.
That was nice, but I want to control how big the window is and have a better name at the top. Change the first line so it looks like this:
win = GraphWin("demo", 500, 300)
Run the program again and you see this:
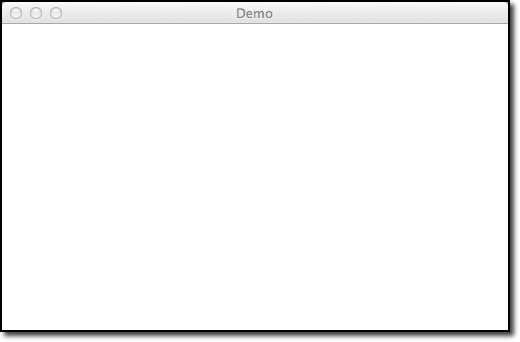
Now, we are in charge!
The coordinate system
All graphics programs make you think about the drawing area in terms of
coordinates. Traditionally, we talk about the X,Y position of something in the
drawing area. X is measured in pixels from left to right. Y is measured in
pixels down from the top of the screen (I know that seems weird!). Let’s place
a simple dot at a point in the middle of our drawing area.
(By the way! What do you thing those two numbers in the top line were about?
Think width (in pixels) and height, also in pixels.)
Add this code before the win.getMouse() line:
pt = Point(250, 150)
pt.draw(win)
The first line tells the graphics system we want to place a Point at a
specified location. By itself, this does nothing visible. It actually creates
another of those funny object things, and this one knows how to make itself
visible. We simply ask it’s troll to activate the draw function, and tell
that function to draw on our graphics window win. Run this and look
closely. You should see a dot in the middle of the screen.
Drawing a circle
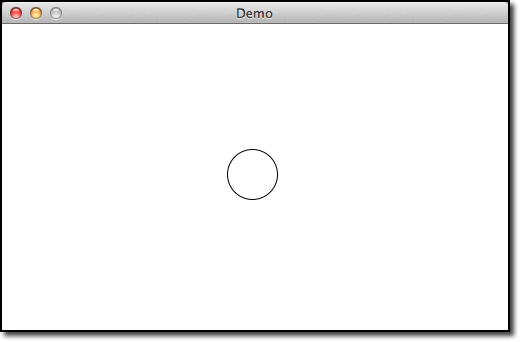
Now for something a bit more interesting. Suppose we want to draw a circle at
the point we set up, not just a dot. We can do that with another function
called Circle. This one takes two parameters, a Point where we want the
circle to be drawn, and a radius controlling how big it is. Change your code
so it looks like this:
pt = Point(250, 150)
cir = Circle(pt, 25)
cir.draw(win)
You should be seeing a pattern to the code we are creating. The things inside
the parentheses on all these function calls are parameters. Some
parameters are just numbers, others strings, and still others are these
funny object things. Python actually considers everything to be an
object as we shall see later. (Do not worry about that for now!)
Run your program and make sure you see this:
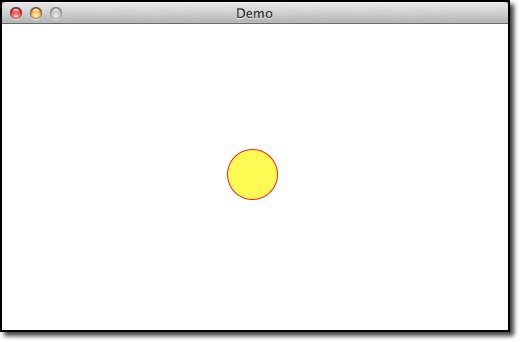
Once again, that is nice, but I want color! Add this line before the drawing action:
cir.setFill("yellow")
Running this gives:
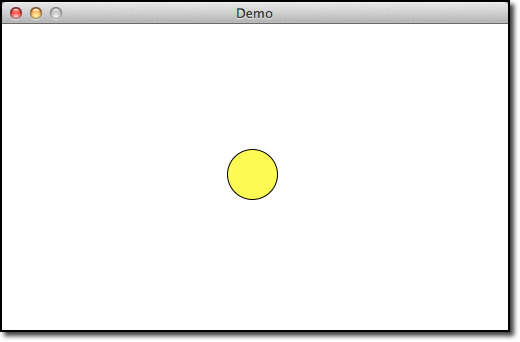
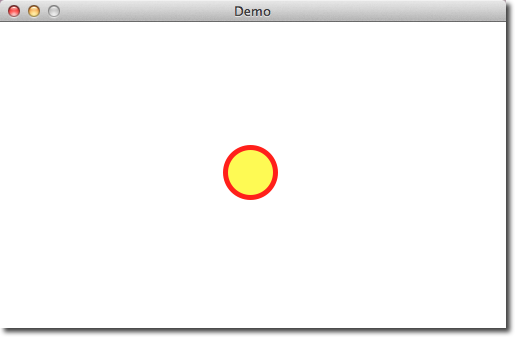
Th only thing I do not like about this image is that ugly black line around the circle. We will deal with that next. Put this line in your code, again, just before the draw line:
cir.setOutline("red")
This produces this:
And if that is not enough, add this line as well:
cir.setWidth(5)
Which is the last exercise with circles!
Now, I do not know how you feel about all this, but when I learned how to program all we had was ugly text output. This is WAY cooler!
Other shapes
Now that we know how to build circles, can we do the same thing with other shapes? Of course! What fun would it be if all we could draw was circles? (Actually, more than you might suspect, as we shall see later!)
Boxes
A box has four corners and is drawn with straight lines. Rather than worry
about things like the width and height, the graphics library uses two
points at opposite corners of the box to control things. Simple! Here is the
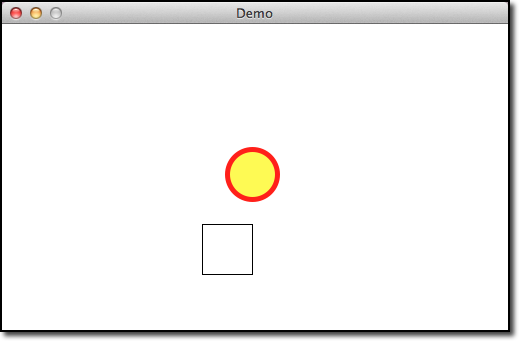
basic code that does the job. Add this code after your circle is done:
pt1 = Point(200, 200)
pt2 = Point(250, 250)
box = Rectangle(pt1, pt2)
box.draw(win)
Here is what I see when I run this:
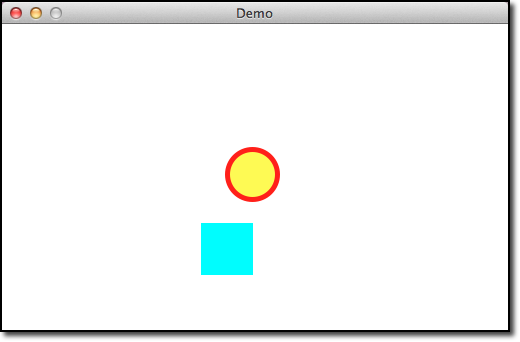
I bet you can make it prettier! Try this:
box.setFill("cyan")
box.setOutline("cyan")
Note
There are a bunch of color names you can use. Here is a link that show some of the color names you can use:
Triangles
A triangle is a bit more complicated, since it has three corners. Actually,
this graphics package uses the more general concept of a polygon to create
a triangle. We need to set up three points for the triangle. Here we go (after
the box code)
pt1 = Point(300, 200)
pt2 = Point(300, 300)
pt3 = Point(350, 200)
tri = Polygon([pt1, pt2, pt3])
tri.draw(win)
Warning
Watch out for the parameter in the Polygon function. It must be
enclosed in square brackets. Formally, this thing is called a list,
something we will learn about later.
Here is my new drawing:
That is all the examples you need to do your next lab project.
Wrapping up
We are not worried about all the details you see here. What we want to focus on
is just the process of activating a function (troll) by handing it a bunch of
those parameter things and causing something to happen. In these examples,
the result is called a side effect because we get nothing back directly,
but rather something happens we are interested in. Exactly how that something
happened is not a concern. If you really want to know, look at the code in the
graphics.py file.
Warning
There is a lot of advanced Python in there, and your head may hurt after looking in that file the first time. But as we work through the course, a lot of it will start to make sense. At this point you do not need to look at the file, and do NOT change anything in it or you risk breaking all your pretty pictures!