Program design tools
Read time: 34 minutes (8594 words)
When we create computer programs, much of your time should be spent thinking about your program, not just typing away and building code. It is critical that you know exactly what you are asking the machine to do, and that what you are asking it to do will actually solve your problem.
Over the years, programmers have developed a number of simple tools to help them out. We will look at three of them here, since they are all simple, and actually do help you make sure you are writing the right program (the one you really want!)
Flow Charts
Way back when I first learned how to program, it was in an engineering language
that is still popular today, FORTRAN, which stands for “Formula Translator”.
Engineers use a lot of formulas, and FORTRAN was designed to help automate
evaluating them using the computer. Back when FORTRAN was about the only
serious language around (for engineers, at least) programmers had a very
difficult time making sure their programs worked they way they wanted, so they
designed a simple graphical way to draw pictures they could use to think
through how their programs “flowed”. We talked about the dance steps, all
written on a card, when we introduced the operation of the computer. Working
through those cards is an example of a simple sequence. We hardly need a
diagram to understand how that program “flows” However, with the addition of
two more basic programming constructs, we do need help to see the “flow”, so we
draw simple “flow charts”
Basic chart symbols
We use a few basic symbols in drawing our diagrams:
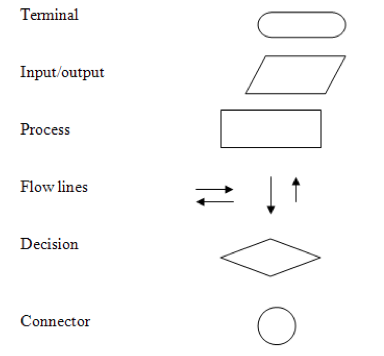
These symbols are defined as follows:
- Terminal
Indicates the beginning or end of the code we are diagramming
- Input/Output
Indicates a point where we get input from the user, or will generate output to the console
- Process
This block encloses a block of operations. We will go over this in more detail soon
- Flow lines
We draw lines between other symbols to indicate where the “flow of execution” goes
- Decision
This block is where we ask a question. Only true of false are allowed as answers. More on this later.
- Connector
Usually, when a diagram gets too complex, we use a connector to indicate we must switch to another sheet to continue. We will not use these in our examples.
The process block
The most important block in a flowchart is the process block. We are trying to do one concrete thing inside this block. If that thing is complicated enough, we might break it down using other tools we will discuss later.
Process blocks always have a flow line coming in (usually from the top) and a flow line going out (usually at the bottom. We do not allow more than one of each. Old programming languages allowed more than one, and we had a lot of chaotic code around. We have learned better in modern languages.
The top line is where we flow into the block. We bring in data at this point in
the process. Inside the block, we crunch on that data and produce something
different. Usually, that output will flow out of the process block. This
block is so important, another tool, called an IPO chart, was developed to
assist in defining what happens in the process block. We will see that later.
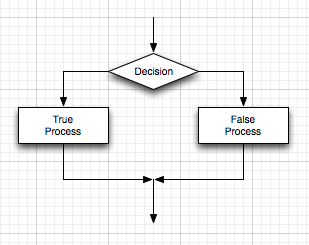
The Decision block
The decision block is the second most important block in our diagramming. We need
to ask questions about what is happening in our code, and those questions are
always in the form of something that has either a true or false answer.
We will draw a single input flow line into a decision block. We will draw to
output flow lines, one for each possible answer. Those output lines will
usually flow into other process blocks where different actions will take place
depending on the answer to our question.
Typical questions in programing ask if two numbers are equal, or greater, or less than each other. Oddly, that is enough to do a lot of neat things.
Standard structures
I said that we had seen the three most important constructs in programming when we looked at simple code last time. Here are the diagrams for those constructs:
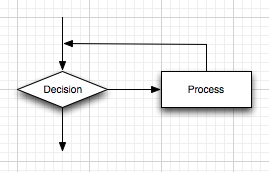
The loop
This one is where we do something over and over:
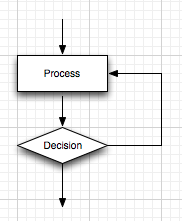
In this example, we enter the process block and do something. We then ask a
question to see if we should do the same thing another time. It should occur to
you that something must happen in the process block to cause us to exit this
diagram. We call this kind of loop the do-until loop because we do
something until we are told to stop.
Another variation on the loop asks the question at the top:
In this loop, we check to see if we need to process something before we do that
process. If the answer id “false”, we skip over the process and fall out. If
the answer is “true”, we do the process and then ask the question again. Once
again, something has to happen inside the process block to cause us to stop
looping. W call this kind of loop the while-do loop.
There are a few other forms of loop, specifically, the counted loop where
we use a counter to control how many times we do the process. (You saw this
loop in the for loop last time. We will not show a diagram for those
additional forms here, since they can be created out of the basic diagrams just
shown.
Combining diagrams
In old-style flowcharts, we just used the symbols any way we felt like it, and out programs were a mess. In today’s programs, we are “structured”, meaning, all diagrams you draw use just these three basic forms. The key way we extend the diagrams is simple:
Any time you see a process block in a diagram, you can place any of the other diagrams inside that box.
We call this “refining” our diagram, moving it closer to a final form.
If you look closely at each diagram, you see a single entry flow line and a single exit flow line. That is the key to doing the refinement. We can expand the box to surround any other diagram form. It will turn out that out programming statement s let us do this very easily. (See the pseudo code discussion below:
What to put in the boxes
We use words or short phrases inside the process boxes and in the question (decision) boxes to indicate what is going on. The phrases may indicate complicated processing, or very simple depending on how complicated the process is. As we refine things, the action will get simpler and simpler until it is clear exactly what we want to do.
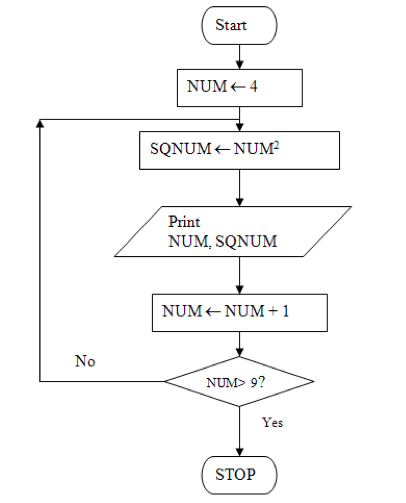
Here is an example of a flow chart with a loop. See if you can figure out what it does:
The IPO Chart
As mentioned above, another common design tool is the Input-Process-Output
chart. For any task you want the computer to do, you need to identify clearly
what data is needed to perform the task, what has to happen to that data to
generate some result, and exactly what output produces you want to see. This
chart is very simple:
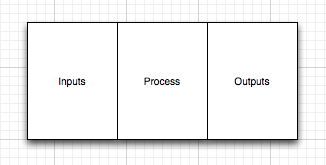
In the input and output blocks, we simply list all the required pieces of data we need. The process block is a description of the task we need to perform. The output block idenitifies the new results we will produce.
Do not be fooled by the simplicity of this chart. It is very important to be
able to build this chart for any process we want to do in the computer. This
will be especially handy when we move into the world of functions soon.
Pseudo-code
The last design tool is actually something developed when we did not have fancy graphics programs to build flowcharts, and did not want to do things by hand. (Pencils, I don’t need no stinking pencils! I have a computer!)
Basically, Pseudo-code is structured English. We use indentation and a few special words to put together something that we could build a flowchart for. Here are examples for each of the basic structures we showed in diagrams above:
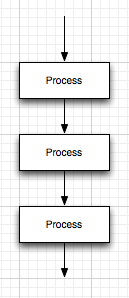
Sequence
We might number the steps in our work:
1. Read input from the user (miles driven, gallons bought)
2. Figure out the gas mileage
3. Output the miles-per-gallon for the last tank
Hey, that sounds like an IPO chart. Know what? Almost all programs exhibit this kind of form.
Decision
Here is a structured pseudo-code form of a decision:
IF hours worked is greater than 40
    Calculate overtime pay
ELSE
    calculate normal pay
END
Do you see how indentation shows what will happen in each situation. The form of the words in all caps is designed to show the question and the two possible sets of actions. If we want to do more than one thing in each section, we simply add more lines, indented as shown.
Loops
We need two examples here:
WHILE there is more work to do
    Do the work
END
This one asks the question first, then only does the work if the answer is “true”. Otherwise, we skip the process and continue after this code.
DO
    work
WHILE there is work to do
Here, we do the work, then check to see if there is more. If so, we do more work.
In pseudo code, we are free to use any notation we like. There is no formal magic pseudo-code style you must use. The basic idea here is to write down what you think needs to happen using just these simple forms. Oddly enough, very complex programs can be formed using this scheme.
The best feature of pseudo code is that you can use your trusty text editor to do this, no fancy graphics program required to build flowcharts, and no ugly pencils!