Exploring the Mandelbrot Image
Read time: 25 minutes (6462 words)
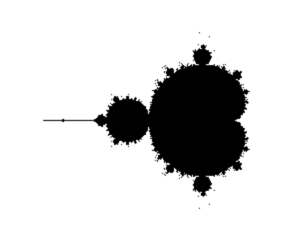
Basically, the Mandelbrot images are generated by calculating an integer number for every point in a region that is approximately within a circle of radius two in the complex plane. The number produced by the calculation is used to generate some color for the graphics display. Sounds simple, but we have some work to do to generate the image.
Image Size
We start off by defining the size of the image we wish to draw, and the complex number we wish to see in the center of that display.
const int WINDOW_WIDTH = 600;
const int WINDOW_HEIGHT = 400;

double cx = -0.5;
double cy = 0.0;
We will call the point in the middle of the image the view point.
Initially want this view point to line up with some chosen spot in the
complex space we are examining. If we initially want to see the entire
world Mandelbrot discovered, that means a circle with a radius of 2, drawn in
Mandelbrot space, needs to be visible in this window.
Let’s look at a bit of simple geometry math, because this kind of thing pops up all the time when you are working with graphics output. More and more, folks need to generate a bunch of data, then visualize those data values somehow, and your job will involve figuring all of the geometry out!
We will limit our work here to 2-dimensional displays, although the step to 3-dimensions is not that hard.
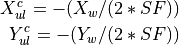
Coordinate Transformations
Basically, we have two different coordinate systems to deal with:
The
graphics world- where our image will be generatedThe
complex world- where the raw data values live
Let’s use subscripts to indicate which world we are talking about. We will use
 to indicate the
 graphics world, and  to indicate the
complex world.
We will specify points in each world using conventional :math`(X,Y)` number
pairs. ( moves along the horizontal axis, increasing to the right,
and :math`Y` moves along the vertical axis, increasing upward.)
moves along the horizontal axis, increasing to the right,
and :math`Y` moves along the vertical axis, increasing upward.)
Here is the situation:
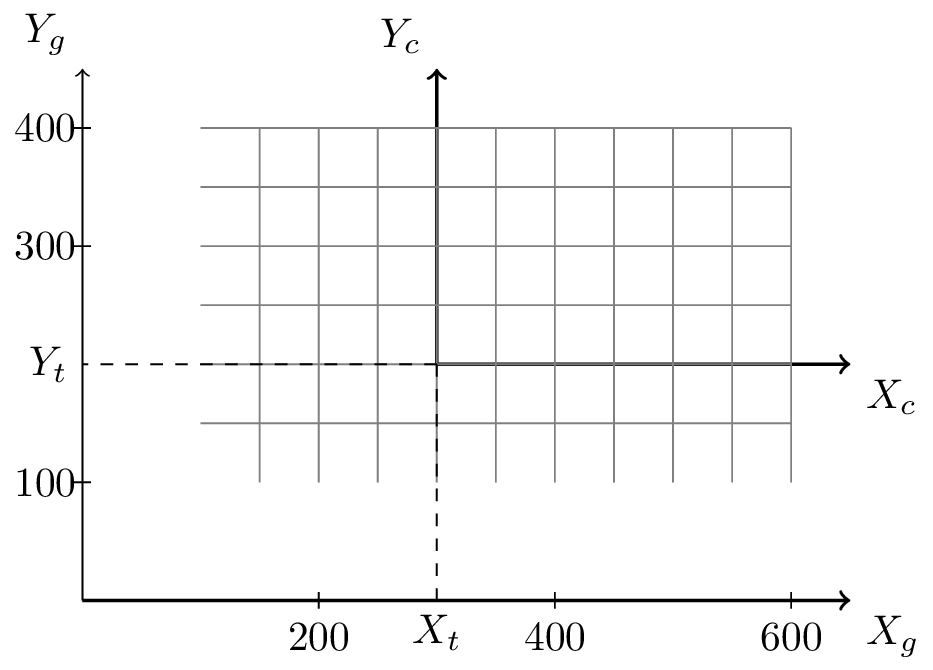
Coordinate Systems
Our graphics window is like a window through which we view the complex world.
Coordinates in our graphics world are normally positive, and we put the
origin of our graphics coordinate system at the lower left corner of our
graphics window.
The origin of the complex world coordinate system is placed at the complex
number  .
.
Figuring out where we “see” a point in the complex world in our graphics
world coordinates is what we need to do!
We can slide that graphics windows back and forth to see different places in the
complex world, and move it in and out to see larger or smaller portions of
that complex world. Sliding is called translating, and moving in and
out is called scaling or zooming.
Translating
Translating is pretty easy. All we are doing is adding or subtracting some number to convert one coordinate value into another one. Let’s use a :math`t` subscript to indicate the translation value.
Here are the formulas we need:
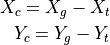
You might need some help in visualizing these formulas. Let’s take that first one and explain it a bit:
The complex world will be drawn on a piece of paper we tape down on a table.
The grphics world is a piece of glass we place on top of that paper. We
will move the glass around over that paper, “translating it by some amount in each
direction. If the value of  is positive, you moved the glass to the
right by that amount. If the value of
is positive, you moved the glass to the
right by that amount. If the value of  is positive, you moved the
glass up.
is positive, you moved the
glass up.
Pick a point in the complex world, and mark that spot on the glass. If we
slide the glass to the right by , the original spot on the paper will
seem to move to the left in our glass window. That means the coordinate we use
on the glass will be smaller (more negative). Think it through until you have
this down!
That was not so hard, was it?
Zooming
Zooming means we make the portion of the world we are looking at bigger or
smaller. We will use  as our subscript for that transformation:

Here, we are using “pixels” as our measurement in the graphics world, and
the scale factor is also in pixels. We want to divide graphics world
numbers by the scale factor to get to our complex world values.
Note
If we use different scale factors for  and
and  we
we
distort the view we see. Normally we will use the same value for both so
the image looks “right”! We will use  for that one value.
Combining these two sets of formulas gives us a general transformation scheme we can use to look into Mandelbrot’s world”
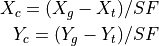
It will be convenient to transform the other way: pick a point in Mandelbrot’s complex world, and figure out where in our graphics world` that point sits:
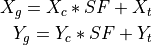
Note
We will need to test these formulas to make sure things are right!
So, our view of Mandelbrot’s world is controlled by three user defined values:
viewpointto the left or right (in pixels)
viewpointup or down (in pixels)
Corner Coordinates
It will be handy to work out the formulas for the complex numbers at the corners of our graphics world, using these three numbers and the size of the graphics window.
Given:
- the point in the
complex worldwe want to be in the middle of thegraphics window
- the window width and height (always positive)
Find:
- the upper left point in the
complex world
- the upper right point in the
complex world
- the lower left point in the
complex world
- the lower right point in the
complex world
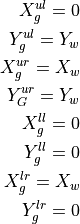
If we want to see the entire world Mandelbrot explored, we need to be able to
see a circle of radius 2 displayed completely in the graphics window. Since the
window height ( ) is the smallest of the two dimensions, that means
we want an initial scale factor of
) is the smallest of the two dimensions, that means
we want an initial scale factor of  .
.
Additionally, Mandelbrot discovered that most of the interesting images were
centered on a complex number of  , so we want our initial
translation to be set so that spot is in the middle of our graphics window, at
, so we want our initial
translation to be set so that spot is in the middle of our graphics window, at 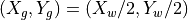 .
.
Here are the formulas we need. (I will leave it for you to check the math!)
These points map to the following complex coordinates:

User Interface
Now we are in a position to think about what we want to see when we view Mandelbrot’s world.
Initially, we will look at the entire world. Mandelbrot discovered an
interesting view if he centered his viewpoint at  :
:
Ideally, choosing all of these values is something the user of our program will be able to control!
double ul_x = -(WINDOW_WIDTH / (2 * scale)); double x2 = x1; double x3 = x1 + WINDOW_WIDTH / scale; double x4 = x3; double y1 = WINDOW_HEIGHT / (2 * scale)); double y2 = y1 - WINDOW_HEIGHT / scale); double y3 = y1 double y4 = y2